Figure 1

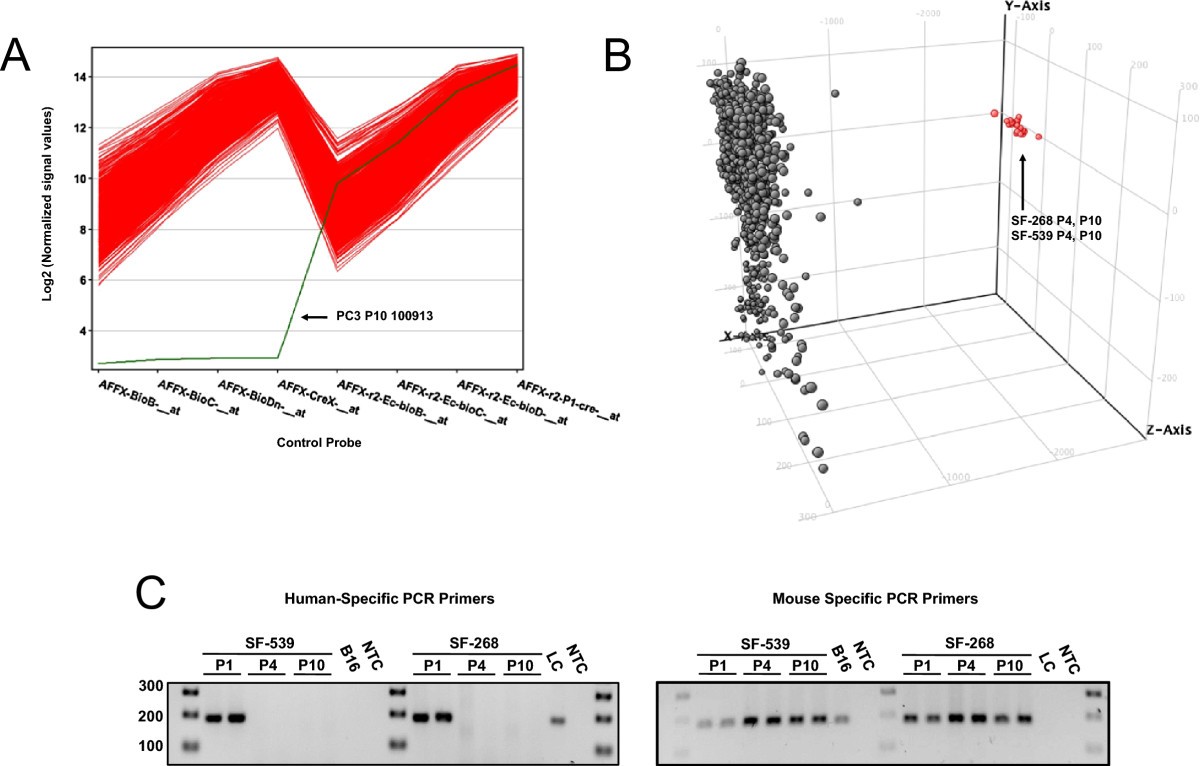
Study design and quality control. A) Control probe signal profiles were generated for 844 Affymetrix HG-U133 Plus 2.0 array .CEL files. The single outlier (PC-3 P10 100913) is highlighted. B) 3D principal component analysis (PCA) was performed on all .CEL files; a population of outliers representing P4 and P10 passages for SF-268 and SF-539 glioma lines is shown in red. Control probe profiles and 3D PCA were generated using Genespring GX11 (Agilent, Santa Clara, CA). C) Endpoint PCR of genomic DNA from SF-539 and SF-268 tumors at P1, P4 and P10 using mouse or human-specific PTGER2 primers [see Methods]. Genomic DNA from B16F10 [B16, Mouse] and LnCAP [LC, human] cell lines were included as positive controls, NTC = no template control. Data is representative of all tumors processed from these xenografts.